The Eyeo Festival is a yearly gathering of creative technologists, spanning the fields of data visualization, generative design, and more. Attending for the first time in 2012, I was blown away to meet so many like-minded people, as well as many of my heroes.
This project was an attempt to visualize the community-building effect of the festival, by comparing the Twitter networks of attendees before and after the event.
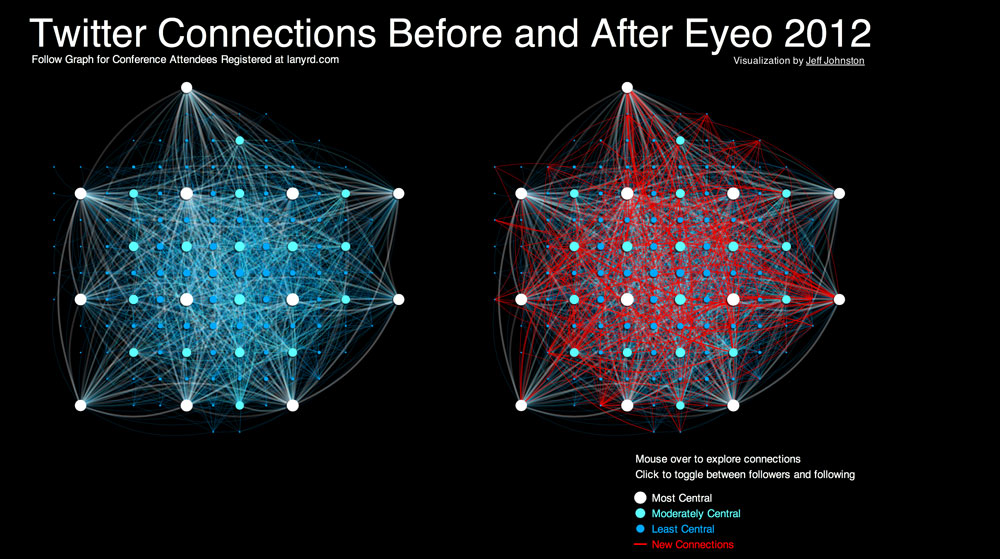
Beginning with the list of attendees and speakers that were registered as attending Eyeo 2012 on lanyrd.com, I took a snapshot of follower relationships on Twitter on the eve of the event, and then again a week after the event ended. Individuals are ranked and coloured by their eigenvector centrality within the follower network, and laid out on a hierarchical grid, building on the technique first employed on the Map of the Internet project for Peer 1.
New connections established during the period of the festival are drawn in red. Mousing over any individual displays statistics and a focused visualization of their new followers and followees.